
Measurement & Measurement Scales
Learning Outcomes
Explain the Concept of Measurement
Understand What Concepts and Constructs are
Distinguish Between Constructive and Operational Definitions
Differentiate Among the Four Levels of Measurement
Describe the Validity and Reliability of a Measurement
Discuss Attitudes, Behaviors, and Rating Scales
What is Measurement?
For any rigorous, scientific investigation of phenomena (people, objects, events, attitudes, or behaviors) measurement is a central concern. Measurement entails developing rules and methods that guide researchers when they assign of numbers or labels to the phenomena under investigation. There is a wide variety of objects or things that researchers measure. The problem for social scientists is that the phenomena we seek to measure are generally too abstract to be classified has either objects or things.
With the social sciences, measurement is the process of linking abstract concepts or constructs to empirical indicants.[1] It is a process involving both theoretical considerations about the concept under investigation and empirical observation or attitudes, behaviors, and events. From an empirical perspective, the researcher focuses his or her attention on an observable response. These responses can take the form of answers to a questionnaire or behavior observed in an observational study. From the theoretical perspective, the researcher focuses on the underlying unobservable—and, therefore, not directly measurable—construct that is represented by the response. When the relationship between the observable response and the unobservable concept is strong, we can make useful inferences about the underlying construct. But when the relationship between the construct and its presumed indicators is weak or faulty, the research could lead to incorrect inferences and misleading conclusions about the construct.
Some things are relatively easy to measure because the rules used to create the measurement are simple. Age, for example is easily measured. We measure a person's age by looking at that persons recorded birth date and the calendar. Gender, on the other hand, is more complex. Historically gender was considered a dichotomous, or binary, variable. Researchers would ask respondents the following either/or question: Are you Male or Female? In recent years, however, there has been a growing awareness that some people are born with atypical gender characteristics that complicate gender identity. A person's gender identity is often no longer considered a simple dichotomous "either/or" or "yes/no" question. As a consequence, non-binary definitions of gender are used more frequently than ever before. Facebook, for example, has over 50 gender options from which users can choose.[2] Some researchers use a two-step protocol when asking questions of gender identity:[3]
Step 1:
What is your current gender identity?
O Male
O Female
O Trans male/Trans man
O Trans female/Trans woman
O Genderqueer/Gender non-conforming
O Different identity (please state): ____________________________
Step 2:
What gender were you assigned on your original birth certificate?
O Male
O Female
Many concepts of interest to researchers—brand loyalty, household income, purchase intent, voter intent—are difficult to measure because it is no easy to establish rules to measure the true value of these attributes.
[1] Carmines, Edward G. and Richard A. Zeller. Reliability and Validity Assessment. Thousand Oaks, CA: Sage Publications Inc., 1979. p. 10.
[2] http://www.slate.com/blogs/lexicon_valley/2014/02/21/gender_facebook_now_has_56_categories_to_choose_from_including_cisgender.html
[3] Singer, T. B., M. Cochran, R. Adamec. Final Report by the Transgender Health Action Coalition (THAC) to the Philadelphia Foundation Legacy Fund (for the) Needs Assessment Survey Project (A.K.A. the Delaware Valley Transgender Survey). Transgender Health Action Coalition: Philadelphia, PA., 1997.
Concepts and Constructs
The first step in the measurement process is to define the concepts we are studying. Researchers generate concepts by generalizing from particular facts. Concepts are based on our experiences. Concepts can be based on real phenomena and are a generalized idea of something of meaning. Examples of concepts include common demographic measures: Income, Age, Eduction Level, Number of SIblings.
We can measure concepts through direct and indirect observations:
Constructs: Constructs are measured with multiple variables. Constructs exist at a higher level of abstraction than concepts. Justice, Beauty, Happiness, and Health are all constructs. Constructs are considered latent variable because they cannot be directly observable or measured. Typical constructs in marketing research include Brand Loyalty, Purchase Intent, and Customer Satisfaction. Constructs are the basis of working hypotheses.
Brand loyalty is a construct that marketing researchers study often. Brand loyalty can be measured using a variety of measures:
An attribute is a single feature or dimension of a construct.
Measurement: Measurement is the assignment of numbers or symbols to phenomena. Measurement requires a scale. A scale provides a range of values—a yardstick—that corresponds to the presence of the properties of the concept under investigation. A scale provides the rules that associate values on the scale to the concept we are studying.
We can classify the values derived from measurement into two broad categories: 1) Variables and 2) Constants.
Variables: Variables are measurements that are free to vary. Variable can be divided into Independent Variables or Dependent Variables. A dependent variable changes in response to changes in the independent variable or variables.
Constants: Constants, on the other hand, do not vary.
In statistics and survey research, responses are typically described as random variables. The value of a random variable varies by chance or in a hit-or-miss or haphazard manner. This means the respondents' responses to a survey cannot be predicted with absolute certainty. For example, when people are asked whether they intend to purchase a new product, or whether they approve or disapprove of a particular public policy there is uncertainty about what the responses will be.
In physics, on the other hand, the speed of light in a vacuum—186,000 miles per second—is a constant. It does not vary.
A variable can be transformed into a constant when the researcher decides to control the variable by reducing its expression to a single value. Suppose a researcher is conducting a test of consumers' taste preference for three brands of frozen pizza. There are a number of variables in this test: 1) Respondents' ratings of the taste of each brand of pizza, 2) The manner in which is each pizza is presented, the type of the plates and table cloths used, and 3) The manner in which each brand is prepared. To get an accurate measure of the first variable—respondents' ratings of the taste of the three pizza brands—the researcher will hold the second and third variables constant. By serving all three pizzas on the same kind of plates with the table dressed in the same manner, preparing the pizzas in identical ways, and serving them at identical temperatures, the research controls for these variables. In doing so, the researcher has removed, or controlled for the affect of the second and third variables on respondents' taste preferences. Researchers call variable 2 and 3 control variables.
Constructive and Operational Definitions
Before a concept or construct can be measured, it must be defined. Researchers develop two kinds of definitions:
Theoretical Definitions: Theoretical definitions are basic dictionary definitions. They are frequently called constitutive or conceptual definitions. A theoretical definition gives meaning to the concept or construct under investigation. It should distinguish it from all other concepts or constructs. A theoretical definition assumes both knowledge and acceptance of the theories it depends upon. For example, a theoretical definition for the concept "customer satisfaction" is often defined as the degree to which a customer's experience with a product or service conforms to his or her expectations and the ideal experience.
Operational Definitions: Operational definitions define an object, event, variable, concept, or construct in terms of the specific processes, tests, and measurements used to determine its presence or quantity. Operational definitions transform theoretical definitions into observable events. This is because an operational definition states which characteristics will be measured in the assignment of a value to the concept or construct under study. Operational definitions form the basis for the research questions, hypotheses, and the theories associated with the research. If a researcher is concerned about levels of brand satisfaction, the researcher could ask customers to rate their experiences with this brand and competitive brands on a five-point scale: Very Satisfied, Satisfied, Neutral, Dissatisfied, and Very Dissatisfied.
Independent and Dependent Variables: With the exception of descriptive studies, all research must have at least two variables: An independent or predictor variable on one hand and a dependent or response variable on the other.
Independent Variable: An independent variable is the input into a process that influences the dependent variable.
Dependent Variable: The dependent variable is the output associated with the independent variable. It is called the dependent variable because it "depends" on or "responds" to other variables. The dependent variable is the result you want to achieve. In marketing, for example, the desired result might be sales revenue.
Let's say we are studying the impact of advertising spending on the sales revenue of 20 product categories. In our study, advertising spending is the independent variable that predicts sales revenue, the dependent or response variable.
In any study there must be at least one independent variable. Typically there is more than one independent variable. Independent variables are associated with changes in the dependent variable. In the example where sales revenue is the dependent variable, the independent variables could include each of the marketing mix strategies (including advertising spending) in addition to competitive brand activity and the state of the economy.
Discreet and Continuous Variables: We can classify a variable as either discreet or continuous. A discrete variable takes one of a series of finite values. A continuous variable can take an infinite number of values on a scale.
A discreet scale is used to classify variables. Here are some examples of a discreet scale.
Are you a full-time student? Yes or No.
Do you agree with the president's policy on immigration? Yes, No, or No Opinion.
A continuous scale measures intensity of a concept. Value can be assigned using an infinite number of values anywhere along a scale. Your weight is a continuous variable. While you might say that you weight 135 pounds. But, your weight fluctuates throughout the day. There are an infinite number of measures between 134 and 136 pounds as you can divide the difference between 134 and 136 pounds into infinititely smaller units.
Levels of Measurement
In 1946, Harvard University psychologist Stanley Smith Stevens developed the theory of the four levels of measurement when he published an article in Science entitled, "On the Theory of Scales of Measurement." In this famous article, Stevens argued that all measurement is conducted using four measurement levels. The four levels of measure, in order of complexity, are:
Nominal
Ordinal
Interval
Ratio
Here is a simple trick for remembering the four levels of measurement: Think "NOIR." Noir is the French word for black. "N" is for nominal. "O" is for Ordinal. "I" is for Interval. And, "R" is for ratio.
Categorical and Quantitative Measures:
The nominal and ordinal levels are considered categorical measures while the interval and ratio levels are viewed as quantitative measures.
Knowing the level of measurement of your data is critically important as the techniques used to display, summarize, and analyze the data depend on their level of measurement.
Let us turn to each of the four levels of measurement.
A. The Nominal Level
The nominal level of measurement is the simplest level. "Nominal" means "existing in name only." With the nominal level of measurement all we can do is to name or label things. Even when we use numbers, these numbers are only names. We cannot perform any arithmetic with nominal level data. All we can do is count the frequencies with which the things occur.
With nominal level of measurement, no meaningful order is implied. This means we can re-order our list of variables without affecting how we look at the relationship among these variables.
Here are some examples of nominal level data:
With the nominal level of measurement, we are limited in the types of analyses we can perform. We can count the frequencies of items of interest, but we cannot sort the data in a way that changes the relationship among the variables under investigation. We can calculate the mode of the frequently occurring value or values. And, we can also perform a variety of non-parametric hypotheses tests. Non-parametric tests make no assumptions regarding the population from which the data are drawn. But, we cannot calculate common statistical measures like the mean, median, variance, or standard deviation.
B. The Ordinal Level
The ordinal level of measurement is a more sophisticated scale than the nominal level. This scale enables us to order the items of interest using ordinal numbers. Ordinal numbers denote an item's position or rank in a sequence: First, second, third, and so on. But, we lack a measurement of the distance, or intervals, between ranks. For example, let's say we observed a horse race. The order of finish is Rosebud #1, Sea Biscuit #2, and Kappa Gamma #3. We lack information about the difference in time or distance that separated the horses as they crossed the finish line.
Here are some examples of ordinal level data:
With the ordinal level of measurement, we can count the frequencies of items of interest and sort them in a meaningful rank order. And, as we said, we cannot, however, measure the distance between ranks. In terms of statistical analyses, we can count the frequency of an occurrence of an event, calculate the median, percentile, decile, and quartiles. We can also perform a variety of non-parametric hypotheses tests. But, we cannot calculate common statistical measures like the mean, median, variance, or standard deviation. And, we cannot perform parametric hypothesis tests using z values, t values, and F values.
C. The Interval Level
With the interval level of measurement we have quantitative data. Like the ordinal level, the interval level has an inherent order. But, unlike the ordinal level, we do have the distance between intervals on the scale. The interval level, however, lacks a real, non-arbitrary zero.
To repeat, here are three characteristics of the interval level:
The classic example of the interval scale is temperature measured on the Fahrenheit or Celsius scales. Let's suppose today's high temperature is 60º F and thirty days ago the high temperature was only 30º F. We can say that the difference between the high temperatures on these two days is 30 degrees. But, because our measurement scale lacks a real, non-arbitrary zero, we cannot say the temperature today is twice as warm as the temperature thirty days ago.
In addition to temperature on the Fahrenheit or Celsius scales, examples of interval scale measures include:
With the interval level of measurement, we can perform most arithmetic operations. We can calculate common statistical measures like the mean, median, variance, or standard deviation. But, because we lack a non-arbitrary zero, we cannot calculate proportions, ratios, percentages, and fractions. We can also perform all manner of hypotheses tests as well as basic correlation and regression analyses.
D. The Ratio Level
The last and most sophisticated level of measurement is the ratio level. As with the ordinal and interval levels, the data have an inherent order. And, like the interval level, we can measure the intervals between the ranks with a measurable scale of values. But, unlike the interval level, we now have meaningful zero. The addition of a non-arbitrary zero allows use to calculate the numerical relationship between values using ratios: fractions, proportions, and percentages.
An example of the ratio level of measurement is weight. A person who weights 150 pounds, weights twice as much as a person who weighs only 75 pounds and half as much as a person who weighs 300 pounds. We can calculate ratios like these because the scale for weight in pounds starts at zero pounds.
n addition to weight, examples of ratio scale measures include:
With the ratio level of measurement, we can perform all arithmetic operations including proportions, ratios, percentages, and fractions. In terms of statistical analyses, we can calculate the mean, geometric mean, harmonic mean, median, mode, variance, and standard deviation. We can also perform all manner of hypotheses tests as well as correlation and regression analyses.
![]()
Reliability and Validity
All researchers strive to deliver accurate results. Accurate results are both reliable and valid. Reliability means that the results obtained are consistent. Validity is the degree to which the researcher actually measures what he or she is trying to measure.
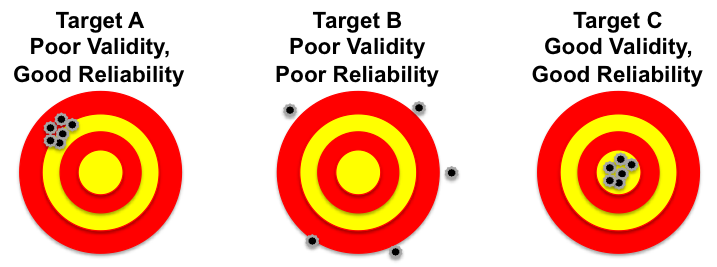
Reliability and validity are often compared to a marksman's target. In the illustration below, Target B represents measurement with poor validity and poor reliability. The shots are neither consistent nor accurate. Target A shows a measurement that has good reliability, but has poor validity as the shots are consistent, but they are off the center of the target. Target C shows a measure with good validity and good reliability because all of the shots are concentrated at the center of the target.
Random Errors: Random error is a term used to describe all chance or random factors than confound—undermine—the measurement of any phenomena. Random errors in measurement are inconsistent errors that happen by chance. They are inherently unpredictable and transitory. Random errors include sampling errors, unpredictable fluctuations in the measurement apparatus, or a change in a respondents mood, which may cause a person to offer an answer to a question that might differ from the one he or she would normally provide. The amount of random errors is inversely related to the reliability of a measurement instrument.[1] As the number of random errors decreases, reliability rises and vice versa.
Systematic Errors: Systematic or Non-Random Errors are a constant or systematic bias in measurement. Here are two everyday examples of systematic error: 1) Imagine that your bathroom scale always registers your weight as five pounds lighter that it actually is and 2) The thermostat in your home says that the room temperature is 72º, when it is actually 75º. The amount of systematic error is inversely related to the validity of a measurement instrument.[2] As systematic errors increase, validity falls and vice versa.
Reliability:
As stated above, reliability is concerned with the extent to which an experiment, test, or measurement procedure yields consistent results on repeated trials. Reliability is the degree to which a measure is free from random errors. But, due to the every present chance of random errors, we can never achieve a completely error-free, 100% reliable measure. The risk of unreliability is always present to a limited extent.
Here are the basic methods for estimating the reliability of empirical measurements: 1) Test-Retest Method, 2) Equivalent Form Method, and 3) Internal Consistency Method.[3]
Test-Retest Method: The test-retest method repeats the measurement—repeats the survey—under similar conditions. The second test is typically conducted among the same respondents as the first test after a short period of time has elapsed. The goal of the test-retest method is to uncover random errors, which will be shown by different results in the two tests. If the results of the two tests are highly consistent, we can conclude that the measurements are stable and reliability is deemed high. Reliability is equal to the correlation of the two test scores taken among the same respondents at different times.
There are some problems with the test-retest method. First, it may be difficult to get all the respondents to take the test—complete the survey or experiment—a second time. Second, the first and second tests may not be truly independent. The mere fact that the respondent participated in the first measurement might affect their responses on the second measurement. And, third, environmental or personal factors could cause the second measurement to change.
Equivalent Form Method: The equivalent form method is used to avoid the problems mentioned above with the test-retest method. The equivalent form method measures the ability of similar instruments to produce results that have a strong correlation. With this method, the researcher creates a large set of questions that address the same construct and then randomly divides the questions into two sets. Both instruments are given to the same sample of people. If there is a strong correlation between the instruments, we have high reliability.
The equivalent form method is also not without problems. First, it can be very difficult—some would say nearly impossible—to create two totally equivalent forms. Second, even when equivalency can be achieved, it may not be worth the investment of time, energy, and funds.
Internal Consistency and the Split-Half Method: These methods for establishing reliability rely on the internal consistency of an instrument to produce similar results on different samples during the same time period. Internal consistency is concerned with equivalence. It addresses the question: Is there an equal amount of random error introduced by using two different samples to measure phenomena?
The split-half method measures the reliability of an instrument by dividing the set of measurement items into two halves and then correlating the results. For example, if we are interested the in perceived practicality of electric cars and gasoline-powdered cars, we could use a split-half method and ask the "same" question two different ways.
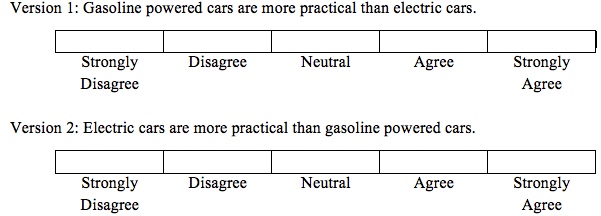
To be reliable, the answers to these two questions should be consistent. The problem with this method is that different "splits" can result in different coefficients of reliability. To overcome this problem researchers use the Cronbach alpha (α) technique, which is named for educational psychologist Lee Cronbach. Cronbach alpha (α) calculates the average reliability for all possible ways of splitting a set of questions in half. A lack of correlation of an item with other items suggests low reliability and that this item does not belong in the scale. Cronbach's alpha technique requires that all items in the scale have equal intervals. If this condition cannot be met, other statistical analysis should be considered. Chronbach's alpha is also called the coefficient of reliability.
Validity:
Validity is defined as the ability of an instrument to measure what the researcher intends to measure. There are several different types of validity in social science research. Each takes a different approach to assessing the extent to which a measure actually measures what the researcher intends to measure. Each type of validity has different meaning, uses, and limitations.[4]
Face Validity: Face validity is the degree to which subjectively is viewed as measuring what it purports to measure. It is based on the researcher's judgment or the collective judgment of a wide group of researchers. As such, it is considered the weakest form of validity. With face validity, a measure "looks like it measures what we hope to measure," but it has not been proven to do so.
Content Validity: Content validity is frequently considered equivalent to face validity. Content or logical validity is the extent to which experts agree that the measure covers all facets of the construct. To establish content validity all aspects or dimensions of a construct must be included. If we are constructing a test of arithmetic and we only focus on addition skills, we would clearly lack content validity as we have ignored subtraction, multiplication, and division. To establish content validity, we must review the literature on the construct to make certain that each dimension of the construct is being measured.
Criterion Validity: Criterion Validity measures how well a measurement predicts outcome based on information from other variables. It measures the match between the survey question and the criterion—content or subject area—it purports to measure. The SAT test, for instance, is said to have criterion validity because high scores on this test are correlated with a students' freshman grade point averages.
There are two types of criterion validity: Predictive Validity and Concurrent Validity. Predictive Validity refers to the usefulness of a measure to predict future behavior or attitudes. Concurrent Validity refers to the extent to which another variable measured at the same time as the variable of interest can be predicted by the instrument. Concurrent validity is evidenced when a measure strongly correlates with a previously validated measure.
Construct Validity: Construct validity is the degree to which an instrument represents the construct it purports to represent. It involves an understanding the theoretical foundations of the construct. A measure has construct validity when is conforms to the theory underlying the construct.
There are two types of convergent validity: Convergent Validity and Discriminant Validity. Convergent validity is the correlation among measures that claim to measure the same construct. Discriminant validity measures the lack of correlation among measures that do not measure the same construct. For there to be high levels of construct validity you need high levels of correction among measures that cover the same construct, and low levels of correlation among measures that cover different constructs.
[1] Carmines, Edward G. and Richard A. Zeller, Reliability and Validity Assessment. Thousand Oaks, CA: Sage Publications Inc., 1979. pp. 14-15.
[2] Carmines, Edward G. and Richard A. Zeller, Reliability and Validity Assessment. Thousand Oaks, CA: Sage Publications Inc., 1979. pp. 13-14.
[3] Carmines, Edward G. and Richard A. Zeller, Richard A., Reliability and Validity Assessment. Thousand Oaks, CA: Sage Publications Inc., 1979. pp. 37-51.
[4] Carmines, Edward G. and Richard A. Zeller, Reliability and Validity Assessment. Thousand Oaks, CA: Sage Publications Inc., 1979. p. 17.
Attitudes, Behaviors, and Rating Scales
Researchers are interested in people's attitudes. An attitudes is a psychological construct. It is a person's predisposition to respond favorably or unfavorably to activities, people, events, and objects. Attitudes are often considered precursors to behavior.
Attitudes have three components:
1) Affective, which deals with a person's feelings and emotions
2) Cognitive, which deals with a person's awareness and knowledge
3) Behavioral, which deals with a person's actions
Researchers have developed a variety of attitude rating scales to measure the intensity of an attitude's affective, cognitive, and behavioral components. These scales may require a respondent to rank, rate, sort, and choose when we assess an attitude.
Scaling refers to the process of assigning numbers or symbols to measure the intensity of abstract attitudes. Scales can be uni-dimensional or multi-dimensional. Uni-dimensional scales measure a single aspect or dimension of an attitude. Multi-dimensional scales measures more than one dimension of an attitude.
Ranking: Ranking is a measurement that asks respondents to rank a small number of items on some characteristic. Respondents might be asked to rank their favorite hot breakfast beverage: Hot Chocolate, Tea, Coffee, or Herbal Tea. Ranking delivers an ordinal score.
Rating: Rating asks respondents the extent to which an item of interest possesses a characteristic. Scales that requires respondents to rank an item result in a quantitative score.
Sorting: Sorting is a measurement task that asks respondents to sort several items into categories.
Choice: Choice is a measurement task that requires respondents to select among two or more alternatives.
Category Scales: Category scales are the simplest type of rating scale. They contain only two choices: yes/no or agree/disagree.
Example:
I approve of the Affordable Care Act or Obama Care.
![]()
We can expand the number of response categories to give respondents greater flexibility in rating the item of interest.
Example:
How often to you this positively about the Affordable Care Act or Obama Care?
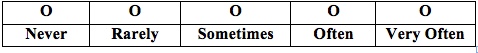
Category scales can deal with a wide variety of issues: Quality, Importance, Interest, Satisfaction, Frequency, Truth, and Uniqueness.
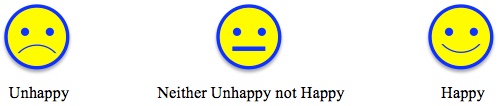
Graphic Rating Scales: Graphic ratings scales include a graphic continuum anchored between two extremes. When used for online surveys, graphic rating scales may have a "slider," which respondents can move up or down the scale. Sliders allow respondents to make finely tuned responses using a continuous scale.
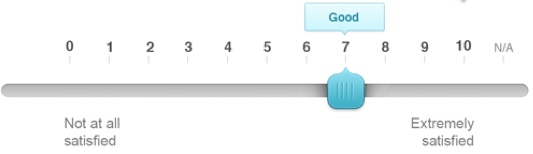
Source: http://www.iperceptions.com/en/blog/2013/august/3-easy-steps-to-build-a-great-survey
Graphic rating scales are easy to create. Researchers must be careful about using overly extreme anchors, which tend to push responses toward the center of the scale. Graphic rating scales are frequently used when conducting research among children. Graphic rating scales are considered non-comparative scales because respondents make their judgments without making comparisons to other objects, concepts, people, or brands.
Eating a Happy Meal at McDonald's make me feel:
Itemized Rating Scales: Itemized rating scales require respondents to select from a limited number of ordered alternatives. These scales are easy to construct, but they do not allow the respondent to make the fine distinctions of a graphic rating scale using a slider.
Example:
How likely are you to use an open-source textbook in the courses you teach?

Graphic rating scales and itemized rating scales ask respondents about a single concept in isolation. Such scales are often called monadic rating scales.
Rank-Order Scales: Unlike graphic rating scales and itemized rating scales, rank-order scales are comparative scales. Responses rank the objects, concepts, people, or brands by comparing them to similar alternatives.
Example:
Rank the following smart phones with one being the brand that best meets the characteristic and six being the brand that is the worst on the characteristic.
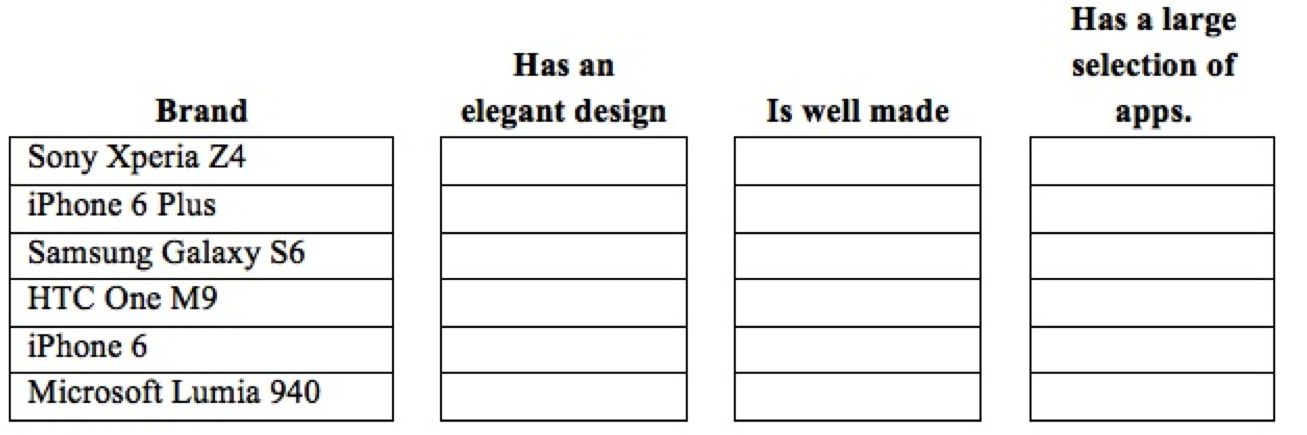
Rank-order scales have the following disadvantages: First, if the alternative choice is missing, the respondent's answer could be misleading. In the question above, the Blackberry 10 is not listed. If that is the respondent's choice, the answer to this question might not reflect his or her real attitude. Second, the answers provided are on an ordinal scale. We will not have the "distance" between the ranks. Third, the question does not offer information as to why the respondent choose the order he or she selected.
Paired Comparisons: Paired comparisons is a measurement scale that asks respondents to select one of two alternatives.
Example:
Listed below are some of the characteristics of a McDonald's Big Mac and a Burger King Whopper. Select the answer that best matches your opinion.
Which of the two brands tastes better?
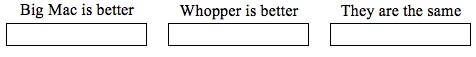
Which of the two brands is healthier?
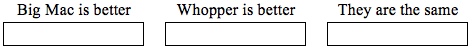
Which of the two brands is a better value for the money?
![]()
Paired comparisons overcome some of the problems of rank-order scales. First, it is easier for respondents to select one item from a choice of two than to rank a larger set of objects, concepts, people, or brands. The question of order bias—bias caused by how the objects, concepts, people, or brands are ordered—is removed. But, the number of pairs to be compared should be kept to a minimum to avoid tiring respondents.
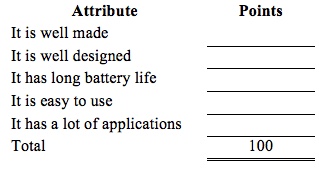
Constant Sum Scales: Constant sum scales require respondents to divide a set number of points, usually 100, to rate two or more attributes. The problem with constant sum scales is that respondents find it difficult to allocate points especially if there are a lot of attributes to be measured.
Example:
Below are five attributes of the iPhone 6 Plus, Please allocate 100 points to these attributes so that they reflect the importance of each attribute. Please make certain that the total number of points adds up to 100.
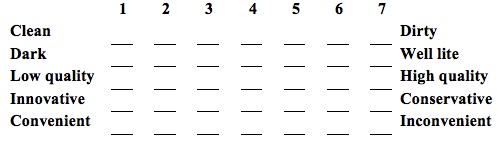
Semantic Differential Scales: Semantic differential scales measure respondents' attitudes about the strengths and weaknesses of a concept or construct. With this scale, researchers select a pair of dichotomous adjectives to describe the concept under investigation. Typically researchers use a scale from 1 through 7. The mean of each pair is calculated and then plotted on the table.
Example:
Below is a list of characteristics of Kmart stores. For each pair of adjectives, place an "X" at the point that you believe best reflects your experience at Kmart.
Semantic Differential Scale Summary Chart
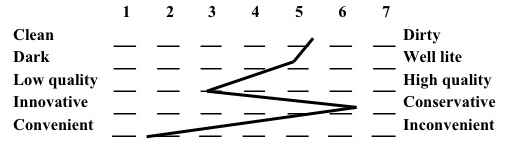
The sematic differential scale is widely used in marketing research because studies have repeatedly shown that this scale is an efficient way to examine the differences in image attributes among a variety of brands or companies. But, semantic differential scales are not without shortcomings. First there are no general scales. Researchers must develop valid and reliable adjective scales for each research project. Researchers should also watch for a "halo" effect, which will bias a respondent's answers. The halo effect is when a respondent's overall impression overwhelms his or her views on a single adjective pair. To counteract the halo effect, researchers never place all of the positive adjectives on the same side of the scale.
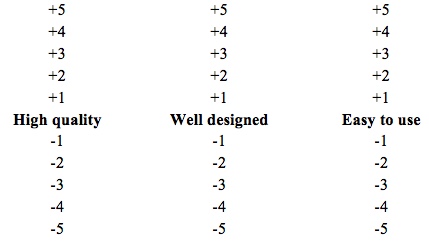
Stapel Scale: The Stapel Scale is a uni-polar scale that requires respondents to rate a concept on a scale of negative 5 to positive 5 on how closely an adjective at the center of the scale represents the concept. The chief advantage of the Stapel Scale is that the researcher does not have to spend the time and energy to creating bipolar pairs.
Example:
Select the appropriate plus number for the phrase that best represents attributes of the iPhone 6. If the phrase does not represent the iPhone 6, select the appropriate negative number that reflects your attitude.
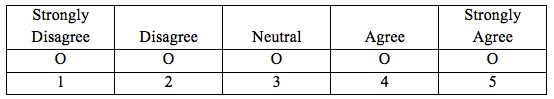
Likert Scale: The Likert scale allows respondents to state how strongly they agree or disagree with an attitude. The scale is named after Rensis Likert, who developed this scale in 1932 for his doctoral dissertation. Likert is pronounced "Lick-ert," not "Like-urt."
Although the Likert scale is typically a five-point scale that ranges from "strongly disagree" to neutral to "strongly agree." It is not uncommon to see a six-point or seven-point variant. A six-point Likert scale has three levels of disagreement and three levels of agreement with no neutral point. The seven-point Likert scale adds a neutral point.
Example:
McDonald's Happy Meals are good value for the money.
My children like eating McDonald's Happy Meals.
Researchers disagree on whether the Likert Scale is an ordinal or interval scale. Those who argue that it is an ordinal scale say the intervals between the five-points of the scale are unknowable. Those who argue that it is an interval scale score "Strongly Disagree" as a 1, "Disagree" as a 2, "Neutral" as a 3, "Agree" as a 4, and "Strongly Agree" as a 5.
Closely related to the Likert Scale is a Purchase Intent scale. The disagreement and agreement statements are replaced with answers that reflect a respondent's intent to purchase a product.
Example:
After owning a Chevrolet Impala for three years, how likely are you to purchase a new Chevrolet Impala?
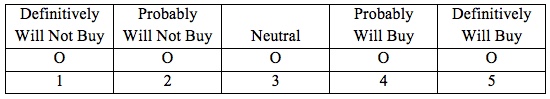
A five-point purchase intent scale is widely used in new product development and advertising testing.
Things to consider when selecting scales:
First consider the objectives of the research and whether the selected scales will help achieve the research objectives. Typically researchers conduct qualitative research before designing the scales. Qualitative research is used to help the researcher gain a deeper understanding of the constructs under investigation.
Using qualitative research helps the researcher select the scales and craft how the scales will be written. Once the scales are written, the researcher will pre-test the survey to make certain it works as expected.
An important question to consider in developing of scales is how the survey will be administered: By an interviewer, self-administered by the respondent on the Internet, self-administered by the respondent using a survey delivered through the mail.
Creating a scale typically involves eight steps.[1]
Step 1: Clarify what is to be measured.
Step 2: Select scale formats (Likert, Stapel, Semantic Differential, etc.). Researchers typically restrict themselves to a limited number of scale formats.
Step 3: Generate a pool of items that will be used to measure the concept or construct.
Step 4: Have others critique the pool of items.
Step 5: Consider adding items that will provide a check on internal consistency. For example, in non-adjacent places ask the respondent's age and birth date.
Step 6: Pre-test the instrument. This is a critical step because it helps researchers learn if respondents are misinterpreting questions.
Step 7: Drop redundant items.
Step 8: Optimize the scale, which involves consideration of reliability and the length of the instrument.
Another consideration: How long does the researcher have to develop the scales. Rank-order scales can be developed quickly while developing a semantic differential scale can take a long time.
Balanced versus Unbalanced Scales: Researchers must decide whether to employ balanced or unbalanced scales. Balanced scales have an equal number of positive and negative categories while unbalanced scales do not. Unbalanced scales are often used when pilot studies suggest that more opinions are positive than negative, or more negative than positive. In these cases, unbalanced scales will give the researcher a more nuanced view of respondents' attitudes.
Forced versus Non-Forced Choice: Sometimes researchers will add a "do not know" category to the range of possible answers. When they are concerned that respondents with limited knowledge will tend to answer with a "neutral" option, if available. Some researchers avoid using a "do not know" answer out of fear that lazy respondents will often check this answer without much reflection.
The argument for "forcing" respondents to answer a question is that it makes them think about their feelings and attitudes. The argument against "forcing" an answer is that respondents will give a "false" answer, or they may refuse to answer the question.
[1] DeVellis, Robert E., Scale Development: Theory and Applications, 3rd Edition., Thousand Oaks, CA: Sage Publications Inc., 2012.