Causal Marketing Research
After completing this lesson you will be able to:
Causal Research is the most sophisticated research market researchers conduct. Its goal is to establish causal relationships—cause and effect—between two or more variables[i]. With causal research, market researchers conduct experiments, or test markets, in a controlled setting. Researchers study how a dependent or response variable—brand sales or brand preference—is effected by changes in a variety of predictor or independent variables: retail price, advertising spending, advertising copy, or other promotional activities. Causality is often expressed as an if/then statement: If X happens, then Y will occur.
To support a causal relationship, the researcher must find more than just a correlation, or an association, among two or more variables. To support a causal inference—a conclusion that if one or more things occur another will follow, three critical things must happen:
Causal Research relies on experiments—test markets—where the researcher can conduct real-world or simulated experiments to ascertain how consumer attitudes, brand market share, and brand sales among other variables respond to changes in marketing mix strategies.
[i] A variable is a characteristic, number, or quantity that changes over time. Marketers are concerned with a wide variety of variables including market share, retail sales, retail price, brand loyalty, consumer characteristics, competitive activity, promotional support, etc. Variables can be defined as independent or dependent. A change in an independent, or predictor variable, predicts a change in the dependent or response variable. In an experiment, there may also be control variables. A control variable is a variable that the researcher holds constant during the experiment.
[ii] http://andrewgelman.com/2012/04/27/how-to-mislead-with-how-to-lie-with-statistics/. Sapsford, Roger; Jupp, Victor, eds. (2006). Data Collection and Analysis. Sage. ISBN 0-7619-4362-5.
When seeking to establish a causal relationship, researchers distinguish among three levels of causation: Absolute Causality, Conditional Causality, and Contributory Causality.
Absolute Causality: Absolute causality means that the cause is necessary and sufficient to bring about the effect. We typically find absolute causation in the physical sciences. Here is an example of absolute causality. When temperatures fall below 32º F, unsalted water begins to freeze. In the social sciences—marketing research, of course, is a social science—it is very unlikely that absolute causality can be established. A researcher might find a strong causal relationship between reducing retail price and increasing retail sales. But, if a researcher finds just one incidence of a price reduction that does not result in increased retail sales, an inference of absolute causality cannot be supported. So while marketing researchers cannot establish absolute causality, they still seek to prove less strenuous versions of causality: Conditional and Contributory Causality.
Conditional Causality: Conditional causality means that a cause is necessary, but not sufficient to bring about an effect. Here is an example of conditional causality from biology: Engaging in sexual intercourse without contraceptives is a necessary but not sufficient cause of pregnancy. In addition to unprotected sexual intercourse other variables must be present: Both partners must be fertile and the sex act must occur while the woman is ovulating. It is very difficult to establish conditional causality. Let's say that the researcher is studying the links between advertising spending and retail sales. It is nearly impossible to establish a conditional causal link between increased advertising spending and increased retail sales. While there is probably a strong correlation between advertising spending levels and retail sales, as a former advertising executive I can attest that there are occasions when increased advertising spending may result in reduced retail sales. And, there are times when sales increase when a brand lacks advertising support. We could not, therefore, demonstrate conditional causality because advertising is not a necessary condition for retail sales.
Contributory Causality: Contributory causality is the weakest form of causality. Contributory causality is when the cause is neither necessary nor sufficient to bring about the effect. With contributory causality a change in the cause is associated with a change in the effect. Contributory causality does not require all variables that experience the cause to demonstrate the effect. The cause, therefore, is neither necessary nor sufficient, but it does contribute to the effect.[i] With contributory causality lurking variables that
cause both the independent and dependent variables must be ruled out. Causal marketing research can establish contributory causality. Researchers could probably establish a contributory causal link between advertising spending and retail sales.
With causal statements, the researchers must avoid a post hoc fallacy. A post hoc fallacy is based on the Latin expression
post hoc, ergo propter hoc, after this, therefore because of this. This fallacy is based on the hasty conclusions that there is a causal relationship between two variables merely because the presumed cause precedes the effect. Here is an example of a post hoc fallacy. Maria is 70-years-old and drinks a glass of Tropicana Orange Juice everyday at breakfast. Maria does not have cancer. Therefore, drinking Tropicana Orange Juice is an effective part of a cancer prevention regime.
[i] http://www.ncbi.nlm.nih.gov/pubmed/450828
Validity, as we discussed in our lesson on measurement, is the extent to which a measurement is free from sampling errors and systematic errors. With experiments there are two kinds of validity that concern marketing researchers: Internal Validity and External Validity.
Internal Validity: Internal Validity refers to the extent to which variations in the response or dependent variable are due to changes in the independent or predictor variable. Laboratory experiments tend to have higher internal validity and experiments conducted in the field—the marketplace—because the laboratory situation makes in easier to isolate the impact of other variables on the dependent variable.
External Validity: External Validity is to which the extent the causal relationship measured in an experiment can be generalized to the population. Field experiments offer higher levels of external validity than laboratory experiments.
Extraneous variables are factors that may confound a researcher's ability to demonstrate causation. Here is a partial list of extraneous variables marketing researchers confront:
1. History: History refers to events that are external to the experiment. These events occur at the same time as the experiment. History makes it more difficult for marketing researchers to get a "clean read" from their test market because the change in the dependent variable may be due to historical events and not the study's independent variables. The longer the experiment the greater the probability that history will impact the research.
Here is an example of this phenomenon from my own career. During my first month as an advertising executive, I travelled to Green Bay, WI with my client from Clairol. Clairol was test marketing a new shampoo that was to compete directly with a shampoo from Proctor & Gamble[i]. We made this trip to visit retailers. Our goal was to check shelf placement, in-store displays, and the availability of our "saleable sample." Clairol was using this saleable sample—a 1 oz. bottle of the shampoo selling at 39¢—to gain trial; which is to say, get shampoo users to try the product. Upon visiting the first store, we immediately noticed that P&G priced a 6 oz. bottle of their brand at 39¢. As a consequence, Clairol's saleable sample tactic failed to achieve the hoped form levels of trial.
2. Maturation: Maturation refers to changes that occur to the test subjects during a test market that are not related to the test market. Maturation effects the test market. The target markets preferences may change because of maturation factors—changes in test subjects' demographics, psychographics, usage behaviors rather than the test variables. The longer the test market, the more likely it will suffer from maturation. Imagine a two-year experiment conducted among teenagers for an Acne remedy. The normal aging of test subjects is a maturation effect, which could severely limit researchers' attempt to make sound conclusions from their findings.
3. Testing Effects: Being part of an experiment changes people and could confound the results. The mere fact of being observed can cause people to change their attitudes and behavior. Advertisers frequently use "pre-post" persuasion tests to measure the effectiveness of advertising. But, such tests can have a testing effect. The fact that people are asked to discuss their purchase intent before seeing an advertisement may influence their perception of the advertisement.
4. Mortality: Mortality refers to the loss of test subjects over time. This is an especially serious problem with longitudinal tests that measure test variables over a long period of time. If a researcher is going to get a read of consumers' attitudes over several time periods, the impact of people dropping out of the study can undermine the validity of the study.
5. Selection Bias: Selection bias is an extraneous variable that undermines an experiment's validity. Selection bias occurs when the test group or control group is significantly different from the population in purports to represent. Let's go back to Clairol's test market in Green Bay. Why Green Bay? Well, when conducting field experiments, marketing researchers look for small, relatively isolated markets, to represent the United States. The goal is to find markets that are "Little USAs." Of course, there are no perfect test markets that give a 100 percent accurate portrayal of the USA.
These extraneous variables are often called confounding variables as they undermine, or confound, the market researcher's ability to draw clear conclusions from an experiment. When conducting an experiment, researchers attempt to control the influence of extraneous variables. Here are some of the techniques they use:
[i] At that time Clairol was own by Bristol-Myers. In 2001 Proctor & Gamble acquired Clairol from Bristol-Myers Squibb.
With an experimental research design, the researcher lays out how he or she will manipulate one of more independent variables and measure their effect on the dependent variable. Some research designs involve no manipulation of independent variables. These non-experimental designs are called ex post facto, or after the effect, studies.
An experimental design must deal with four issues:
Types of Experimental Research Designs
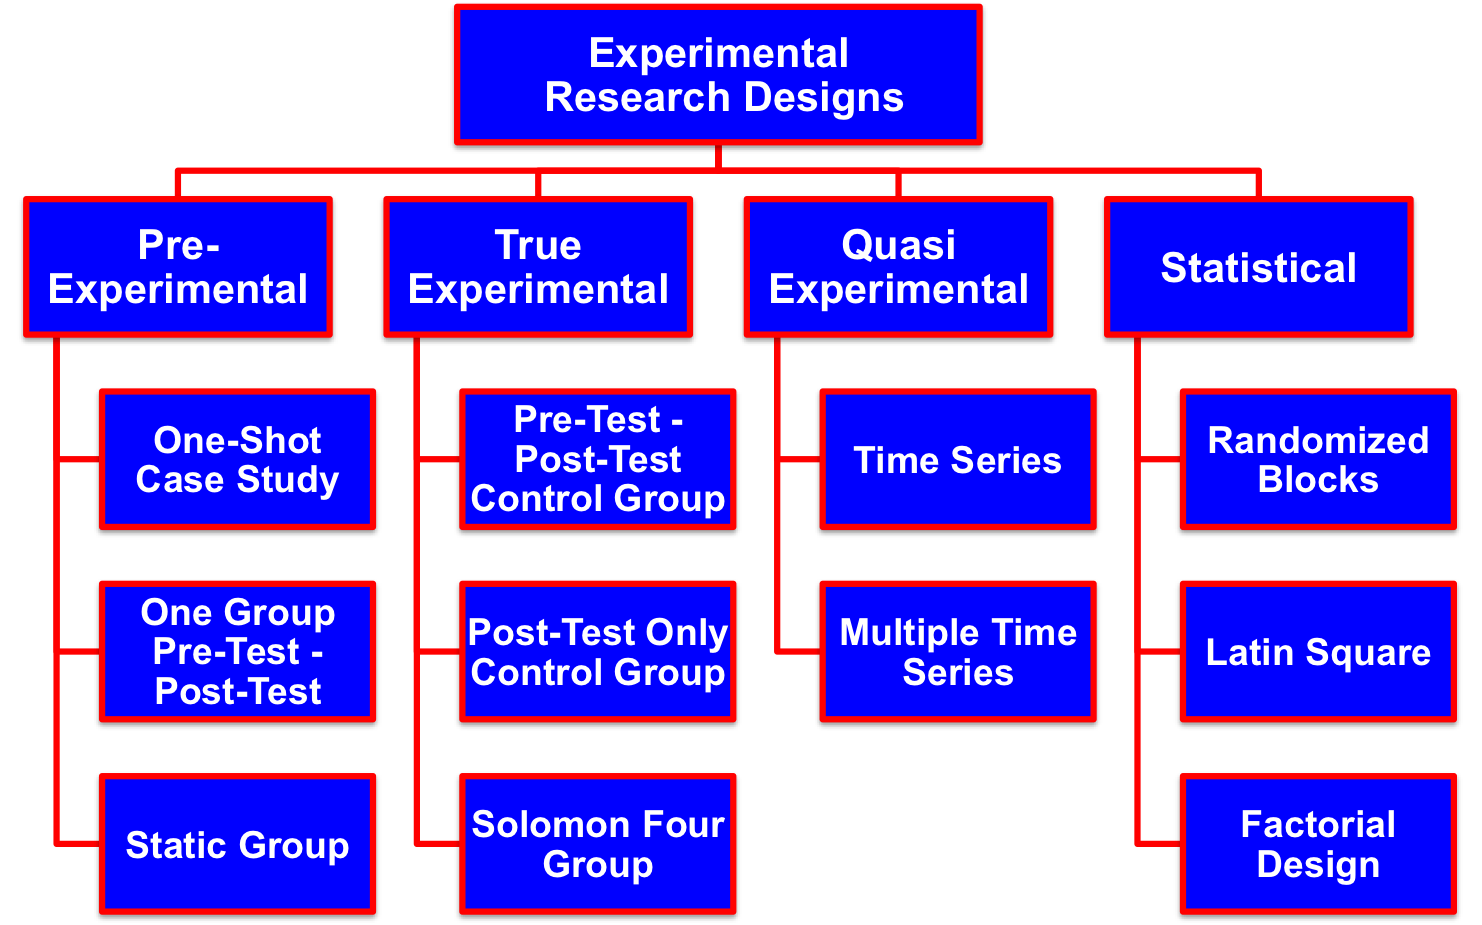
Experimental research designs can be classified into the following typology:
Figure 1
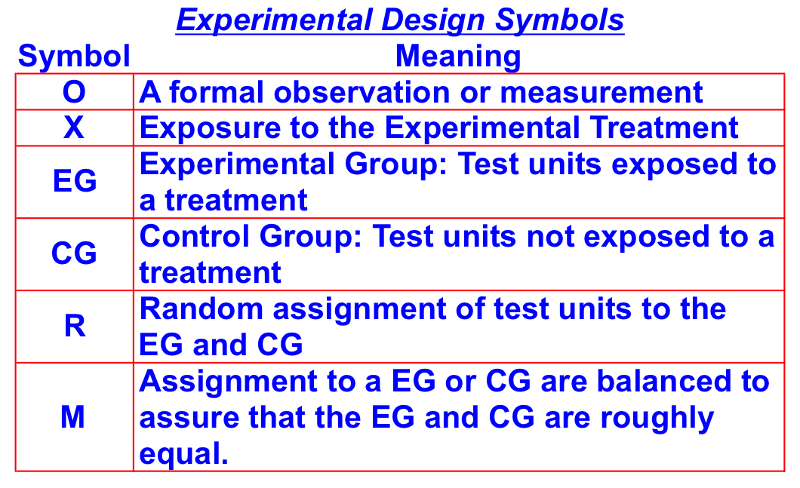
Figure 2
Pre-Experimental Designs are the simplest form of experimental research designs. Pre-experimental designs have little or no control over extraneous variables. And, these designs do not randomly assign subjects to different treatments. As a consequence, the results of a test using a pre-experimental design are difficult to interpret. These designs are often used in testing television commercials because they are simple and relatively inexpensive.
There are three types of pre-experimental designs: One-Shot Case Studies, One Group Pre-Test - Post-Test, and Static Group tests
A. One-Shot Case Studies: With a one-shot case study, test units—people, test markets, etc.—are exposed to a treatment. The standard notion for a treatment is the symbol "X." A single measurement of the dependent variable is taken (O1). There is no random assignment of test subjects as there is only one treatment, and there is no control. Here is the standard notation for a One-Shot Case Study:

Figure 3
This research design has two significant flaws: 1) there is no pre-test and 2) there is no control group. A control group would, in this case, be a group that did not receive the treatment. Without these restraints, this research design cannot establish internal or external validity.
Despite these limitations, market researchers often use this design for testing new-to-the-market products.
B. One Group Pre-Test - Post-Test: With this research design the test unit is measured twice, one before the test and once after the test. There is still no control group; which is to say, a group not receiving the treatment. Here is the standard notation for a one-group pre-test - post-test study:

Figure 4
Marketing researchers often use this design to test changes in the marketing plan for established products. Compared to One-Shot Case Studies, this design has the advantage of taking two measurements: one before and the other after exposure to the treatment. This allows the researcher to estimate the treatment effect by subtracting the pre-test measure from the post-test measure. But, given the lack of a control, the validity of the conclusions are questionable. Extraneous variables like history can affect the results because the observed changes in the dependent variable might be due to factors outside the research design. And, maturation can also be a problem as the observed changes to the dependent variable might be due to changes in the test subjects that are not related to the treatment.
C. Static Group Design: With the Static Group design there is a Control Group (CG) in addition to the Experimental Group (EG). The experimental group is exposed to the treatment while the control group is not. Test units, however, are not randomly assigned to the control or experimental groups. Here is the standard notation for a Static Group study:

Figure 5
Measurements for both groups are made after the treatment is administered to the experimental group. The treatment effect is measured as O1 - O2.
Weaknesses of this research design stem from the fact that test units are not randomly assigned to the experimental or control groups and there are no pre-test measurements taken.
True Experimental Designs are where the market researchers assign test units to treatments at random. There are three basic types of True Experimental Designs: Post-Test Only Control Group Design, Pre-Test Post-Test Control Group Design, and Solomon Four Group Design.
A. Post-Test Only Control Group Design:
With this research design, test units are randomly assigned to the experimental and control groups. The experimental group is exposed to the treatment and then both the experimental and control groups are measured. But, there is only one measurement is taken.
Here is the standard notation for a Post-Test Only study:
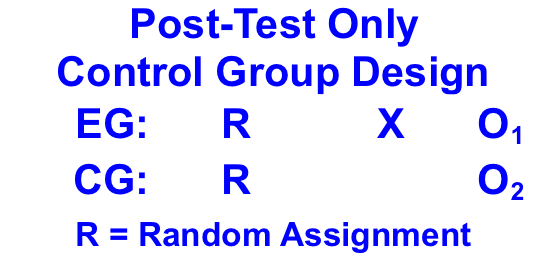
Figure 6
The effect of the treatment is calculated as O1 - O2.
The advantage of this research design is that the random assignment of the test units should produce roughly equal control and experimental groups before the treatment is administered. And, the mortality for the control and experimental groups should be similar.
B. Pre-Test - Post-Test Control Group Design:
With this research design, test units are randomly assigned to experimental and control groups. A pre-test measure is taken from both groups.
Here is the standard notation for a Pre-Test - Post-Test Control Group study:
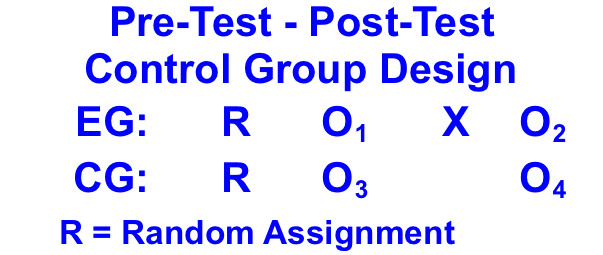
Figure 7
Selection bias is controlled by the randomized assignments of test units. Mortality can be a problem if it is not relatively equal between the experimental and control groups. History can also be an issue if these factors effect the experimental and control groups unequally.
The treatment effect or TE is measured by (O2 O1) - (O4 O3).
C. Solomon Four Group Design:
The Solomon Four Group Design is a research design that assesses the impact of pretesting on subsequent measures.[i] It is used when the researcher suspects that earlier tests influence the results of later tests. With this research design, test units are randomly allocated to two experimental groups and two control groups. One of the experimental groups and one of the control groups is measured. Both experimental groups are then exposed to a treatment. Afterwards, both experimental and control groups are measured. A total of six measurements are taken. The design aims to account for pre-testing bias and pre-test manipulation interaction bias.
Here is the standard notation for a Solomon Four Group study:

Figure 8
Quasi-Experimental Designs are used when the researcher creates an artificial environment to control for extraneous variables. With quasi-experimental designs, the research lacks control over when the treatment is administered or assigns test units to the experimental and control groups in a non-random fashion. There are two basic types of quasi-experimental designs: Time Series and Multiple Time Series.
A. Time Series: There is no randomization of the test units to the treatments. The timing of the treatment presentation as well as which test unites are exposed to the treatment may not be within the researcher's control. Consumer Attitude & Usage panels are an example of quasi-experimental designs using Time Series.
Here is the standard notation for a Time Series study:

Figure 9
The advantages of Time Series are that it is easier to interpret the results than a One Group Pre-Test - Post-Test design because of the many measures it takes. The multiple measures help determine underlying trends. But, the Time Series design has two weaknesses. First, researchers cannot control history. Second, given the repeated measures there is a testing effect on the subjects. Subjects may become more aware of their shopping habits, which could influence the results of the study.
B. Multiple Time Series: With the Multiple Time Series, the researchers add a control group to the research design. The addition of a control group enhances the researchers' ability to discern the treatment effect.
Here is the standard notation for a Multiple Time Series study:
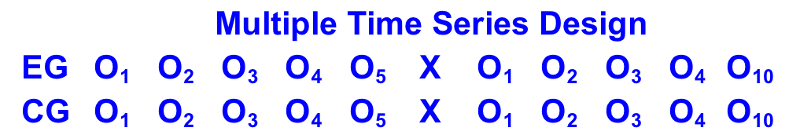
Figure 10
Statistical Designs are a collection of basic experimental designs that offer researchers the ability to statistically control and analyze external variables. Statistical control uses various sophisticated statistical techniques to exclude the influence of extraneous variables from an analysis.
The most commonly used Statistical Research Designs are the Randomized Block Design, the Latin Square Design, and the Factorial Design. These designs offer the following advantages: 1) The effects of multiple independent variables on the dependent variable can be measured, 2) Specific extraneous variables can be statistically controlled, and each test unit can be measured more than once with these economically efficient designs. These designs are beyond the scope of an introductory Marketing Research class. We will not, therefore, cover them in any detail.
[i] Paul J. Lavraka. (2008). Encyclopedia of Survey Research Methods. http://srmo.sagepub.com/view/encyclopedia-of-survey-research-methods/n540.xml
Marketing Research Experiments, or test markets, can be conducted in a laboratory or in the field. Lets compare laboratory tests to field tests.
The first distinction between field test and laboratory tests is the environment in which they are conducted. Field tests are conducted in the marketplace. A marketplace is a much more realistic venue to test a marketing plan than the artificial environment of a market laboratory. The big advantage of laboratory experiments is that the researchers have much more control over extraneous variables. But, laboratory tests are more prone to reactive error than field studies. Reactive errors occur when the subjects of a study (survey respondents or consumers in test markets) are affected either by the instruments of the study or the individuals conducting the study in a way that changes whatever is being measured.[i]
Internal validity is higher with laboratory tests than field tests, but external validity is lower than that of field tests. Field tests take considerably more time to complete than lab tests, they are conducted among larger samples, and they cost significantly more money. And, because of the controlled environment, laboratory tests are easier to administer than field tests.
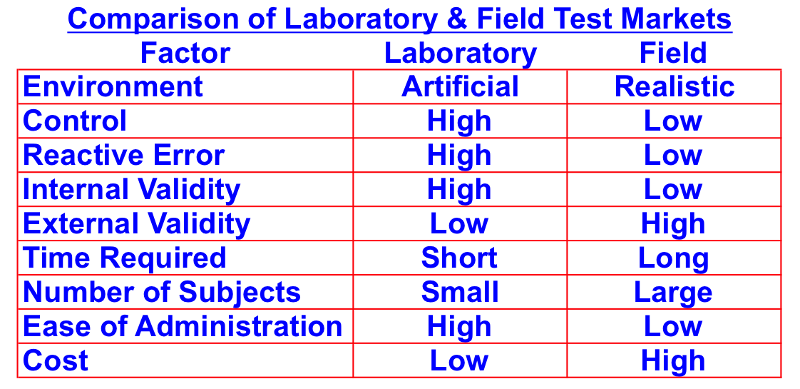
Figure 11
[i] Paul J. Lavraka. (2008). Encyclopedia of Survey Research Methods. http://srmo.sagepub.com/view/encyclopedia-of-survey-research-methods/n448.xml
Test markets offer marketers the opportunity to test new ideas before incurring the expense and risk of a national introduction. Marketers use test markets to experiment with:
There are three types of test markets: Standard test markets, controlled test markets, and simulated test markets. Marketers of consumer packaged goods are the primary users of test markets. Consumer packaged goods (CPGs) are products that are sold in packages that consumers use almost everyday. Due to the low cost of switching products and the short purchase cycle, consumer packaged goods markets are very competitive. Consumer packaged goods include breakfast cereal, packaged coffee brands, carbonated soft drinks sold in cans or bottles, laundry detergent, over-the-counter analgesics, soap, and cigarettes.
Standard Test Markets: Standard Test Markets are like a normal national marketing campaign except that they are conducted in a limited number of cities that are a fair representation of the national market. The marketer does everything in these test cities that it would do in the national market. The sales force sells the product to distributors and retailers. Marketing mix strategies are devised and implemented. To measure the performance of the test market, the marketer tracks sales, conducts surveys of consumers and distributors, tracks in-store activities. Results are then compared to the national campaign.
The advantage of a standard test market is that the marketer gets to measure the real-world performance of its marketing plan. But, there are a number of serious disadvantages. The primary disadvantage is that competitors learn about the marketer's new product or new marketing strategies well before the national introduction. This gives competitors ample time to prepare a counter attack and an opportunity to interfere with the test market. Other drawbacks are that standard test markets are very expensive and can take as long as three years to complete.
Controlled Test Markets: Controlled test markets provide marketers with an artificial testing venue that is cheaper and faster than standard test markets. Two companies offer controlled test markets: ACNielsen's Scantrack and Information Resources Inc.'s BehaviorScan. Controlled test markets are used most often with new product introductions. With a controlled test market, the research supplier offers the marketer a panel of stores. Suppliers monitor the checkout scanner data to measure initial and repeat purchases as well as the sales of competitive products. Distribution of the marketer's brand is "forced" into these stores. This has an advantage and disadvantage. The advantage is that distribution is guaranteed. The disadvantage is that the marketer cannot gauge retailer's reactions to the new product. Other disadvantages of controlled test markets are that competitors can look at the new product before its national launch. Another concern is that even though the Scantrack and BehaviorScan propriety models are very sophisticated, it is questionable whether the shoppers at the test stores actually represent "average" targeted consumers for the brand being test marketed.
Simulated Test Markets: Like controlled test markets, simulated test markets were designed to overcome the drawbacks of standard test markets. Simulated test markets are not conducted in real-world markets; they are laboratory tests. A simulated test market is a staged or artificial marketplace where researchers expose subjects to advertising and other marketing mix variable to gauge the subjects' purchase intent. Simulated test markets are significantly faster and cheaper than standard test markets because the marketer does not have to execute the entire marketing plan.
The companies that run simulated test marketing—ACNielsen's Bases, Harris Interactive's Litmus, and Synovate's MarkeTest—use a variety of mathematical models to estimate the effects of the tested variables.
Here is how a simulated test market works:
Before committing the investment of time and money, marketers should consider the following questions:
Steps to Implement a Test Market
While only causal research can establish causal relations, it has some serious limitations compared to exploratory and descriptive research. Here are some limitations that cause many marketers to think carefully before embarking on causal research.