Writing a Marketing Research Report
After completing this module, you will be able to:
A research report is an oral or written presentation to management detailing a research project's objectives, methodology, findings, and recommendations. Typically, written reports are more detailed that an oral report, which presenters usually deliver in an hour or an hour-and-a-half.
he objective of a research report is to provide a clear, accurate and complete report of the research project. It should help clarify the research issues so management can use the findings as an aid to decision-making.
Good research reports are clearly written and presented. The authors avoid using unnecessary jargon. Experienced report writers know that their audience, while composed of marketers, may not be experts in all aspects of marketing research. Good reports present an honest, accurate, and unbiased review of the research objectives, methodology, and findings. And, good reports present a complete review of the data gathered. Reports should include appendices that show all data. It is very common for executives from the client's organization and its promotion agencies to study these data with great care to see if alternate conclusions can be supported.
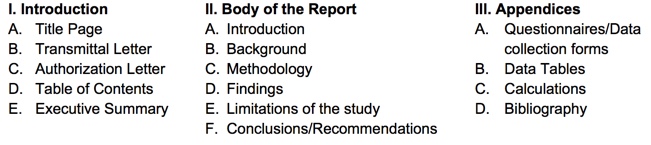
While the elements of actual reports may vary slightly, a basic research report has three sections:
Section I: Introduction
Section II: Body of the Report
Section III: Appendices
Here is an outline of a standard written research report. Actual reports may vary somewhat from this outline:
The first page of the research report is the Title Page. This page should include the following elements:
The transmittal letter is a one-page letter or memo written by the lead person on the team that prepared the report. This letter is usually written on official letterhead, which includes the name of the marketing research firm responsible for the report and the name and contact information of the lead person from that firm
The letter serves as proof that the report was sent to the client. It:
This is a letter written by the client to the marketing research firm. This letter acknowledges receipt of the research proposal made by the market research firm. And, it authorizes the marketing researcher to conduct a research project. It is written on corporate letterhead. It includes the name, title, and contact information of the author. The fee structure and delivery dates for the research are clearly spelled out. The letter concludes with a statement that the client looks forward to the successful conclusion of the study and suggests a follow-up telephone call should the lead marketing researcher have any questions or concerns.
The table of contents is based on the final outline of the report. It includes a list of the report's sections and sub-sections, and their respective page numbers.
The executive summary is a short synopsis of the research report. Some might even call it the mini-report. It is typically no more than four pages long. It is intended to provide busy senior executives with the highlights of the study. An effective Executive Report includes the following elements:
The body of the marketing research report includes the following sections:
This section of the report reviews the objectives of the research. It summarizes the research proposal and highlights any changes to the research design that were agreed to after the client approved the proposal. Please Note: It is highly unprofessional for market researchers to change the research design without getting their client's expressed approval.
This section covers a review of the literature and secondary research. And, if relevant, this section cites primary research sponsored by the client on similar issues.
In the case of Exploratory Research, this section lists the research questions. With Descriptive or Causal Research, the null and alternate hypotheses are spelled out.
This is the most technical section of the research report. It includes the following sections:
Research Design:
This includes a statement of the type of research conducted: Exploratory, Descriptive, or Causal. Secondary research sources are mentioned along with a description of how primary data were collected. And, the authors should include a rationale for why the research design is appropriate for achieving the research objectives and answering the research questions. In an appendix, the authors of the report include any discussion guides, questionnaires or observation forms.
Sample Design:
This section includes:
Details about the samples and calculations used in the sampling should be included in the appendices.
Data Collection and Fieldwork: This section reviews how the fieldwork was conducted. It states the number and types of fieldworkers, how they were trained and supervised, and how the accuracy of their work was verified.
Statistical Analysis:
A review of the statistical methods employed in the analysis. This section provides a rationale for these methods, but the actual analysis is not presented.
Glossary:
A glossary may be included to define any technical terms that might be unknown to experienced managers.
The findings section is the longest part of the research report. It is where the results of the study are reported in detail. This section should include supporting tables and graphs. Tables and graphs make the report easier to read and more memorable. To avoid overwhelming the reader, the findings should refer the reader to the detailed data, which should be in an appendix.
No research design is perfect; they all have their limitations. Good researchers always state the limitations of their research.
After the findings are presented, the researchers present their conclusions and recommendations, including conducting further research.
[1] A sampling frame defines a set of elements from which a researcher can select a sample of the target population. Source: http://srmo.sagepub.com/view/the-sage-encyclopedia-of-social-science-research-methods/n884.xml
[2] Sampling units are the individual items—people or households—included in a sample.
The appendices of the marketing research report include all technical materials and data related to specific parts of the study. These materials may be of interest to only a few readers. Materials posted in one of the appendices may not deal directly with the research objectives.
The appendices include the following:
Important research attracts the interest a managers. Good researchers and good clients are skeptical. After reading the report and attending the presentation, many executives may have serious questions. These executives often spend hours pouring over the appendices. They may raise questions about the validity, reliability, logic, and conclusions of the research. Good marketing research expect and welcome these inquiries.
Research reports are presented in writing and in oral presentations.
Written presentations are far more detailed than oral presentations. Oral presentations are often done with presentation software like PowerPoint. Oral presentations cannot cover all of the details covered in the written presentations. There is simply not enough time to read the entire report at a presentation. Reading slides with multiple sentences is a sure way of boring your audience. PowerPoint slides should have few words. Each slide should focus on a single idea supported with a picture, table, or chart. Good presenters know what they want to communicate. They rehearse. And, they connect with their audience by making eye contact.
Researchers use tables and charts to communicate their ideas.
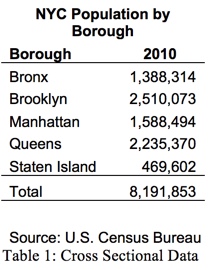
Tables are a useful way of presenting numerical data. The numbers are presented in vertical columns and horizontal rows. Tables can organize the data longitudinally or by cross section.
Cross sectional data divides the data into its component parts. Here us an example of cross sectional data:
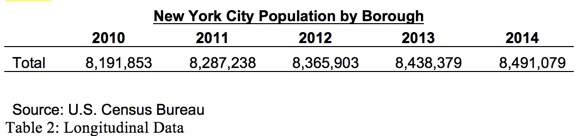
Longitudinal data shows how the data changes over time. Here us an example of longitudinal data:
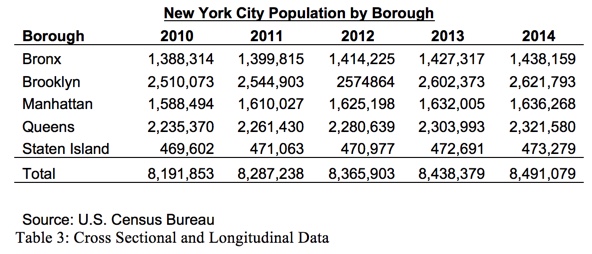
Cross sectional and longitudinal data can be combined in a single table:
A good table should have:
Charts provide a graphic representation of data. Just like tables, a chart should have:
Bar or Column Charts
Bar charts are used to present cross sectional data. The heights of the columns depict the size or magnitude of each section
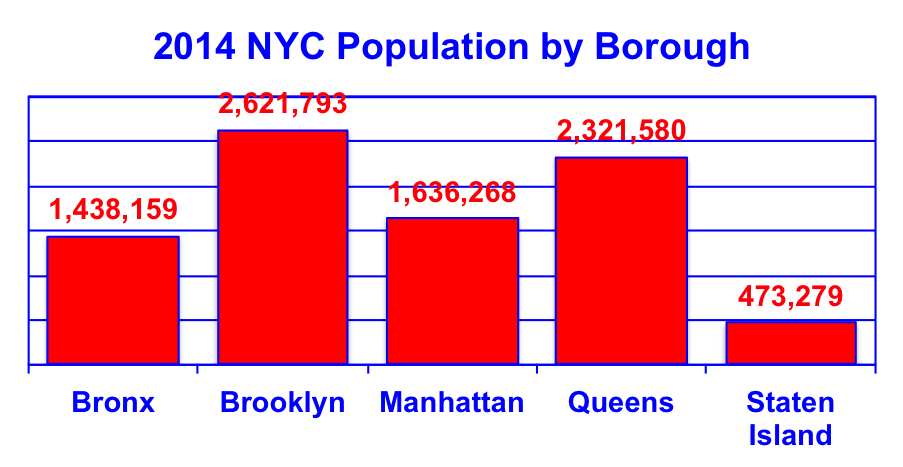
Chart 1: Bar or Column Chart
Pie Charts
Pie charts are used to present cross sectional data. They show the proportion of each section
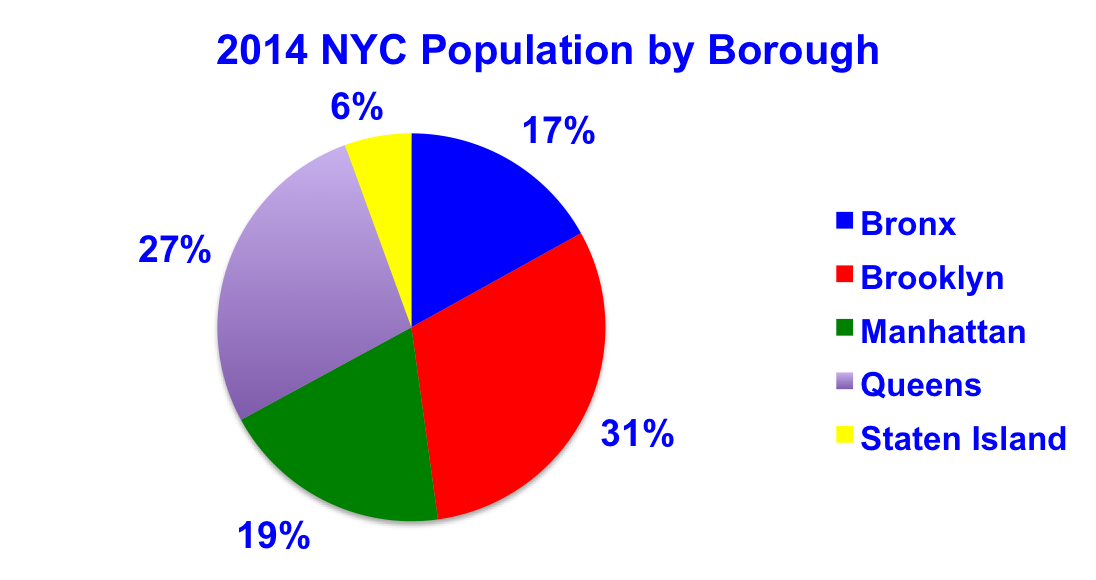
Chart 2: Pie Chart
Line Charts
Line charts are used to present longitudinal data.
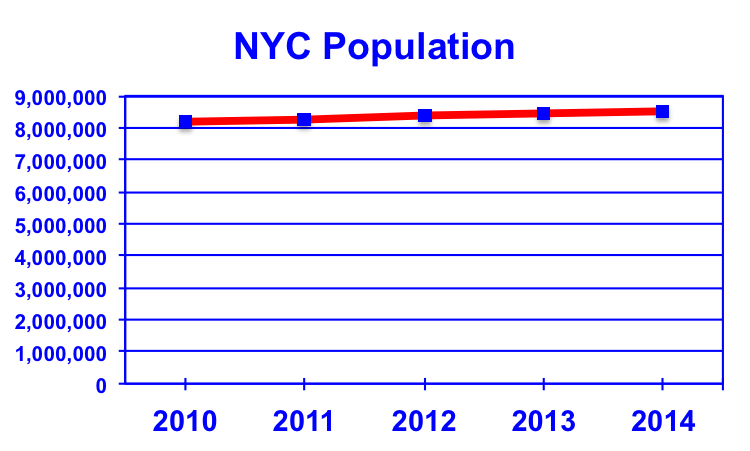
Chart 3: Line Chart