
Attitudes, Behaviors, and Rating Scales
Researchers are interested in people's attitudes. An attitudes is a psychological construct. It is a person's predisposition to respond favorably or unfavorably to activities, people, events, and objects. Attitudes are often considered precursors to behavior.
Attitudes have three components:
1) Affective, which deals with a person's feelings and emotions
2) Cognitive, which deals with a person's awareness and knowledge
3) Behavioral, which deals with a person's actions
Researchers have developed a variety of attitude rating scales to measure the intensity of an attitude's affective, cognitive, and behavioral components. These scales may require a respondent to rank, rate, sort, and choose when we assess an attitude.
Scaling refers to the process of assigning numbers or symbols to measure the intensity of abstract attitudes. Scales can be uni-dimensional or multi-dimensional. Uni-dimensional scales measure a single aspect or dimension of an attitude. Multi-dimensional scales measures more than one dimension of an attitude.
Ranking: Ranking is a measurement that asks respondents to rank a small number of items on some characteristic. Respondents might be asked to rank their favorite hot breakfast beverage: Hot Chocolate, Tea, Coffee, or Herbal Tea. Ranking delivers an ordinal score.
Rating: Rating asks respondents the extent to which an item of interest possesses a characteristic. Scales that requires respondents to rank an item result in a quantitative score.
Sorting: Sorting is a measurement task that asks respondents to sort several items into categories.
Choice: Choice is a measurement task that requires respondents to select among two or more alternatives.
Category Scales: Category scales are the simplest type of rating scale. They contain only two choices: yes/no or agree/disagree.
Example:
I approve of the Affordable Care Act or Obama Care.
![]()
We can expand the number of response categories to give respondents greater flexibility in rating the item of interest.
Example:
How often to you this positively about the Affordable Care Act or Obama Care?
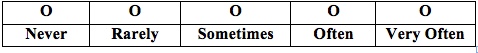
Category scales can deal with a wide variety of issues: Quality, Importance, Interest, Satisfaction, Frequency, Truth, and Uniqueness.
Graphic Rating Scales: Graphic ratings scales include a graphic continuum anchored between two extremes. When used for online surveys, graphic rating scales may have a "slider," which respondents can move up or down the scale. Sliders allow respondents to make finely tuned responses using a continuous scale.
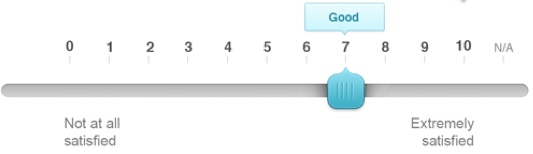
Source: http://www.iperceptions.com/en/blog/2013/august/3-easy-steps-to-build-a-great-survey
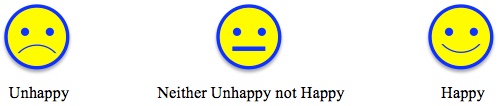
Graphic rating scales are easy to create. Researchers must be careful about using overly extreme anchors, which tend to push responses toward the center of the scale. Graphic rating scales are frequently used when conducting research among children. Graphic rating scales are considered non-comparative scales because respondents make their judgments without making comparisons to other objects, concepts, people, or brands.
Eating a Happy Meal at McDonald's make me feel:
Itemized Rating Scales: Itemized rating scales require respondents to select from a limited number of ordered alternatives. These scales are easy to construct, but they do not allow the respondent to make the fine distinctions of a graphic rating scale using a slider.
Example:
How likely are you to use an open-source textbook in the courses you teach?

Graphic rating scales and itemized rating scales ask respondents about a single concept in isolation. Such scales are often called monadic rating scales.
Rank-Order Scales: Unlike graphic rating scales and itemized rating scales, rank-order scales are comparative scales. Responses rank the objects, concepts, people, or brands by comparing them to similar alternatives.
Example:
Rank the following smart phones with one being the brand that best meets the characteristic and six being the brand that is the worst on the characteristic.
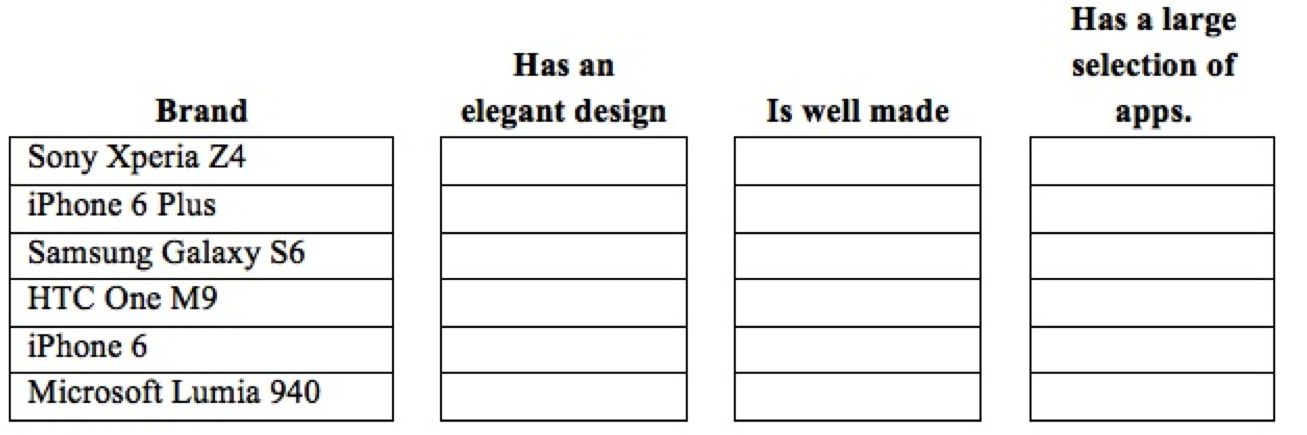
Rank-order scales have the following disadvantages: First, if the alternative choice is missing, the respondent's answer could be misleading. In the question above, the Blackberry 10 is not listed. If that is the respondent's choice, the answer to this question might not reflect his or her real attitude. Second, the answers provided are on an ordinal scale. We will not have the "distance" between the ranks. Third, the question does not offer information as to why the respondent choose the order he or she selected.
Paired Comparisons: Paired comparisons is a measurement scale that asks respondents to select one of two alternatives.
Example:
Listed below are some of the characteristics of a McDonald's Big Mac and a Burger King Whopper. Select the answer that best matches your opinion.
Which of the two brands tastes better?
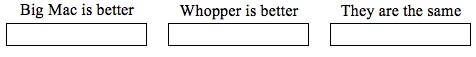
Which of the two brands is healthier?
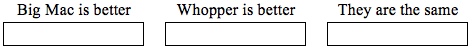
Which of the two brands is a better value for the money?
![]()
Paired comparisons overcome some of the problems of rank-order scales. First, it is easier for respondents to select one item from a choice of two than to rank a larger set of objects, concepts, people, or brands. The question of order bias—bias caused by how the objects, concepts, people, or brands are ordered—is removed. But, the number of pairs to be compared should be kept to a minimum to avoid tiring respondents.
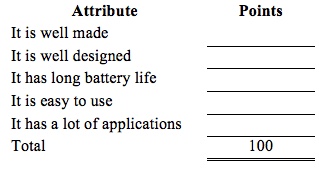
Constant Sum Scales: Constant sum scales require respondents to divide a set number of points, usually 100, to rate two or more attributes. The problem with constant sum scales is that respondents find it difficult to allocate points especially if there are a lot of attributes to be measured.
Example:
Below are five attributes of the iPhone 6 Plus, Please allocate 100 points to these attributes so that they reflect the importance of each attribute. Please make certain that the total number of points adds up to 100.
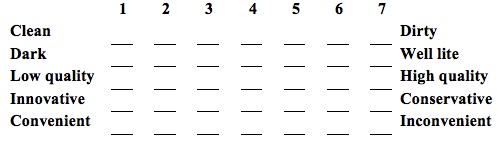
Semantic Differential Scales: Semantic differential scales measure respondents' attitudes about the strengths and weaknesses of a concept or construct. With this scale, researchers select a pair of dichotomous adjectives to describe the concept under investigation. Typically researchers use a scale from 1 through 7. The mean of each pair is calculated and then plotted on the table.
Example:
Below is a list of characteristics of Kmart stores. For each pair of adjectives, place an "X" at the point that you believe best reflects your experience at Kmart.
Semantic Differential Scale Summary Chart
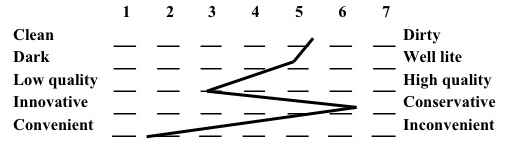
The sematic differential scale is widely used in marketing research because studies have repeatedly shown that this scale is an efficient way to examine the differences in image attributes among a variety of brands or companies. But, semantic differential scales are not without shortcomings. First there are no general scales. Researchers must develop valid and reliable adjective scales for each research project. Researchers should also watch for a "halo" effect, which will bias a respondent's answers. The halo effect is when a respondent's overall impression overwhelms his or her views on a single adjective pair. To counteract the halo effect, researchers never place all of the positive adjectives on the same side of the scale.
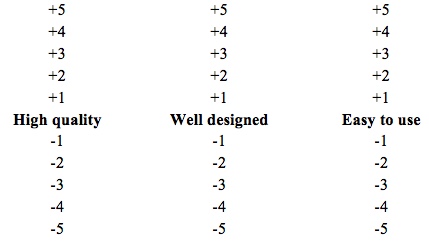
Stapel Scale: The Stapel Scale is a uni-polar scale that requires respondents to rate a concept on a scale of negative 5 to positive 5 on how closely an adjective at the center of the scale represents the concept. The chief advantage of the Stapel Scale is that the researcher does not have to spend the time and energy to creating bipolar pairs.
Example:
Select the appropriate plus number for the phrase that best represents attributes of the iPhone 6. If the phrase does not represent the iPhone 6, select the appropriate negative number that reflects your attitude.
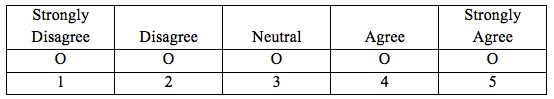
Likert Scale: The Likert scale allows respondents to state how strongly they agree or disagree with an attitude. The scale is named after Rensis Likert, who developed this scale in 1932 for his doctoral dissertation. Likert is pronounced "Lick-ert," not "Like-urt."
Although the Likert scale is typically a five-point scale that ranges from "strongly disagree" to neutral to "strongly agree." It is not uncommon to see a six-point or seven-point variant. A six-point Likert scale has three levels of disagreement and three levels of agreement with no neutral point. The seven-point Likert scale adds a neutral point.
Example:
McDonald's Happy Meals are good value for the money.
My children like eating McDonald's Happy Meals.
Researchers disagree on whether the Likert Scale is an ordinal or interval scale. Those who argue that it is an ordinal scale say the intervals between the five-points of the scale are unknowable. Those who argue that it is an interval scale score "Strongly Disagree" as a 1, "Disagree" as a 2, "Neutral" as a 3, "Agree" as a 4, and "Strongly Agree" as a 5.
Closely related to the Likert Scale is a Purchase Intent scale. The disagreement and agreement statements are replaced with answers that reflect a respondent's intent to purchase a product.
Example:
After owning a Chevrolet Impala for three years, how likely are you to purchase a new Chevrolet Impala?
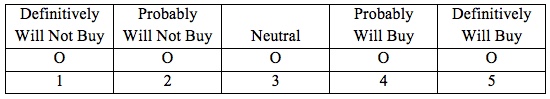
A five-point purchase intent scale is widely used in new product development and advertising testing.
Things to consider when selecting scales:
First consider the objectives of the research and whether the selected scales will help achieve the research objectives. Typically researchers conduct qualitative research before designing the scales. Qualitative research is used to help the researcher gain a deeper understanding of the constructs under investigation.
Using qualitative research helps the researcher select the scales and craft how the scales will be written. Once the scales are written, the researcher will pre-test the survey to make certain it works as expected.
An important question to consider in developing of scales is how the survey will be administered: By an interviewer, self-administered by the respondent on the Internet, self-administered by the respondent using a survey delivered through the mail.
Creating a scale typically involves eight steps.[1]
Step 1: Clarify what is to be measured.
Step 2: Select scale formats (Likert, Stapel, Semantic Differential, etc.). Researchers typically restrict themselves to a limited number of scale formats.
Step 3: Generate a pool of items that will be used to measure the concept or construct.
Step 4: Have others critique the pool of items.
Step 5: Consider adding items that will provide a check on internal consistency. For example, in non-adjacent places ask the respondent's age and birth date.
Step 6: Pre-test the instrument. This is a critical step because it helps researchers learn if respondents are misinterpreting questions.
Step 7: Drop redundant items.
Step 8: Optimize the scale, which involves consideration of reliability and the length of the instrument.
Another consideration: How long does the researcher have to develop the scales. Rank-order scales can be developed quickly while developing a semantic differential scale can take a long time.
Balanced versus Unbalanced Scales: Researchers must decide whether to employ balanced or unbalanced scales. Balanced scales have an equal number of positive and negative categories while unbalanced scales do not. Unbalanced scales are often used when pilot studies suggest that more opinions are positive than negative, or more negative than positive. In these cases, unbalanced scales will give the researcher a more nuanced view of respondents' attitudes.
Forced versus Non-Forced Choice: Sometimes researchers will add a "do not know" category to the range of possible answers. When they are concerned that respondents with limited knowledge will tend to answer with a "neutral" option, if available. Some researchers avoid using a "do not know" answer out of fear that lazy respondents will often check this answer without much reflection.
The argument for "forcing" respondents to answer a question is that it makes them think about their feelings and attitudes. The argument against "forcing" an answer is that respondents will give a "false" answer, or they may refuse to answer the question.

[1] DeVellis, Robert E., Scale Development: Theory and Applications, 3rd Edition., Thousand Oaks, CA: Sage Publications Inc., 2012.
toc | return to top | previous page
Date last modified: April 13, 2015.
Copyright © Edward Volchok 2015. Permission is granted, free of charge, to any person obtaining this website to use it and distribute it. Users may not alter it. This website is provided "as is," without any kind of warranty. In no event shall the author or copyright holder be liable for any claim, damages, or other liability arising out of or in connection with this website.

![]()
